Octave Sampling
February 29, 2024About 1 min
We can write a simple program in Octave to observe the sampling issue of a single-frequency cosine wave. Here we assume the signal frequency is 9, and we observe the results of signal sampling at sampling rates of 100 and 10, respectively. The code is as follows:
% Define the time vector for one second duration
t = 0:0.001:1; % Time from 0 to 1 second with 1ms interval

% Define the frequency of the cosine wave
f = 9; % Frequency of 9 Hz

% Generate the cosine wave
cosine_wave = cos(2*pi*f*t);

% Plot the original cosine wave
figure; % Create a new figure
subplot(3,1,1);
plot(t, cosine_wave);
title('Original Cosine Wave (9 Hz)');

% Sample the cosine wave at 100 Hz
fs1 = 100; % Sampling rate of 100 Hz
n1 = 0:1/fs1:1; % Sample times
samples1 = cos(2*pi*f*n1);

% Plot the sampled signal at 100 Hz
subplot(3,1,2);
stem(n1, samples1);
title('Sampled at 100 Hz');

% Sample the cosine wave at 10 Hz
fs2 = 10; % Sampling rate of 10 Hz
n2 = 0:1/fs2:1; % Sample times
samples2 = cos(2*pi*f*n2);

% Plot the sampled signal at 10 Hz
subplot(3,1,3);
stem(n2, samples2);
title('Sampled at 10 Hz');

% Show the results
xlabel('Time (seconds)');
ylabel('Amplitude');
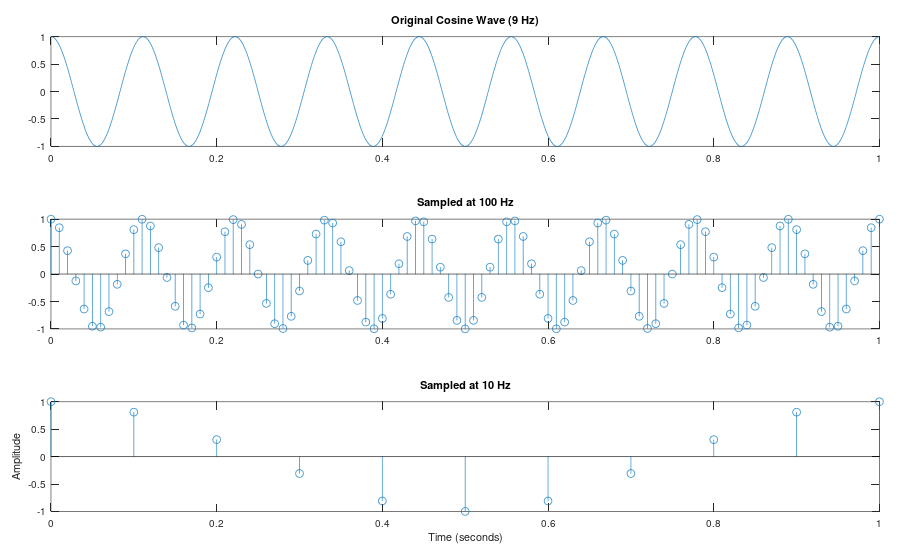
The results of the program execution are as follows:

From the results, we can see that with a sampling rate of 100, the sampled result is very similar to the original signal; however, with a sampling rate of 10, the result is far from the original signal.
Exercise 3
- The sampling figure at the bottom also looks like a cosine wave, and its frequency seems to be closer to what? Why is this the result?
- So far, all discussed signals have been single-frequency. If the signal is composed of two frequencies, what would be the appropriate sampling frequency? For example, if the signal frequencies are 9 and 20, modify the above code to observe the results with different sampling rates and explain the results.
- If the signal is composed of many different frequency components, how should the sampling rate be set? Explain your reasoning.
