Octave 取樣
2024年2月29日大约 2 分鐘
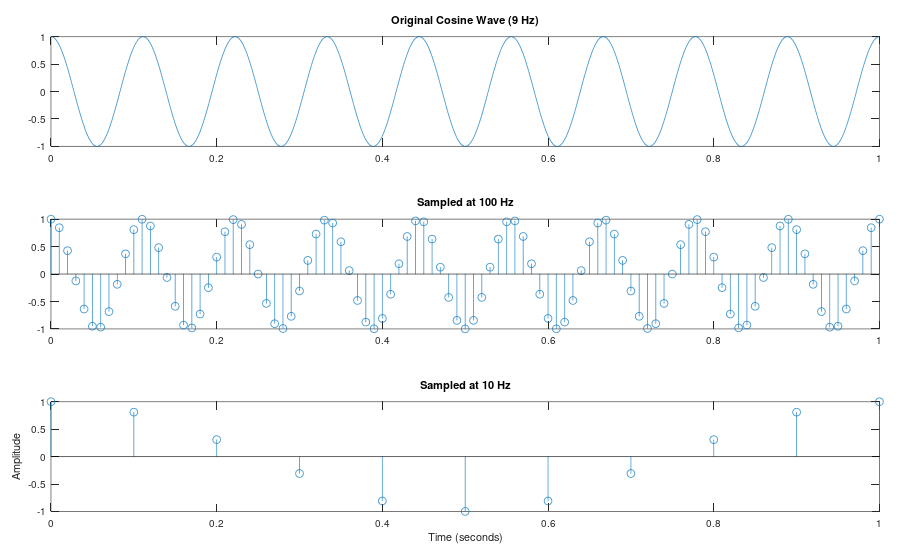
我們可以用 Octave 寫一個簡單的程式,來觀察單一頻率弦波的取樣問題。這邊一樣假設信號頻率為9,然後我們分別用取樣頻率100和10來觀察信號取樣的結果。程式碼如下:
% Define the time vector for one second duration
t = 0:0.001:1; % Time from 0 to 1 second with 1ms interval

% Define the frequency of the cosine wave
f = 9; % Frequency of 9 Hz

% Generate the cosine wave
cosine_wave = cos(2*pi*f*t);

% Plot the original cosine wave
figure; % Create a new figure
subplot(3,1,1);
plot(t, cosine_wave);
title('Original Cosine Wave (9 Hz)');

% Sample the cosine wave at 100 Hz
fs1 = 100; % Sampling rate of 100 Hz
n1 = 0:1/fs1:1; % Sample times
samples1 = cos(2*pi*f*n1);

% Plot the sampled signal at 100 Hz
subplot(3,1,2);
stem(n1, samples1);
title('Sampled at 100 Hz');

% Sample the cosine wave at 10 Hz
fs2 = 10; % Sampling rate of 10 Hz
n2 = 0:1/fs2:1; % Sample times
samples2 = cos(2*pi*f*n2);

% Plot the sampled signal at 10 Hz
subplot(3,1,3);
stem(n2, samples2);
title('Sampled at 10 Hz');

% Show the results
xlabel('Time (seconds)');
ylabel('Amplitude');
程式執行的結果如下:

觀察執行的結果,可以發現取樣速度100的時候,取樣結果與原來的信號非常相似;但取樣速度10的結果,則與原來的信號相距甚遠。
練習 3
- 最下方的取樣圖形,看起來也很像一個弦波,它的頻率看起來比較接近多少?為什麼會有這樣的結果?
- 到目前為止,所有談到的信號都是單一頻率,如果信號是兩個頻率合成的,那麼取樣的頻率怎樣才算恰當呢?譬如信號有兩個頻率分別為 9 和 20,修改以上的程式碼,分別用不同的取樣頻率觀察結果,並針對結果做一些說明。
- 如果信號是由更多不同頻率成分所合成的,取樣的速度應該如何設定較好?說明你的理由。
