
Python Sampling
Python has many packages available for use, among which numpy and matplotlib are frequently used for data processing. The former is used for various matrix operations, and the latter for plotting graphs. Together, these two can perform many of the functions of MATLAB/Octave programs, with very similar syntax.
We will assume the signal frequency is 9, and then observe the results of signal sampling at sampling rates of 100 and 10, respectively. The code is as follows:
import numpy as np
import matplotlib.pyplot as plt

# Define the time vector for one second duration
t = np.arange(0, 1, 0.001)  # Time from 0 to 1 second with 1ms interval

# Define the frequency of the cosine wave
f = 9  # Frequency of 9 Hz

# Generate the cosine wave
cosine_wave = np.cos(2 * np.pi * f * t)

# Plot the original cosine wave
plt.figure()
plt.subplot(3, 1, 1)
plt.plot(t, cosine_wave)
plt.title('Original Cosine Wave (9 Hz)')

# Sample the cosine wave at 100 Hz
fs1 = 100  # Sampling rate of 100 Hz
n1 = np.arange(0, 1, 1/fs1)  # Sample times
samples1 = np.cos(2 * np.pi * f * n1)

# Plot the sampled signal at 100 Hz
plt.subplot(3, 1, 2)
plt.stem(n1, samples1, 'r', markerfmt='ro', basefmt=" ")
plt.title('Sampled at 100 Hz')

# Sample the cosine wave at 10 Hz
fs2 = 10  # Sampling rate of 10 Hz
n2 = np.arange(0, 1, 1/fs2)  # Sample times
samples2 = np.cos(2 * np.pi * f * n2)

# Plot the sampled signal at 10 Hz
plt.subplot(3, 1, 3)
plt.stem(n2, samples2, 'g', markerfmt='go', basefmt=" ")
plt.title('Sampled at 10 Hz')

# Show the results
plt.xlabel('Time (seconds)')
plt.ylabel('Amplitude')
plt.tight_layout()
plt.show()
The execution results are as follows:
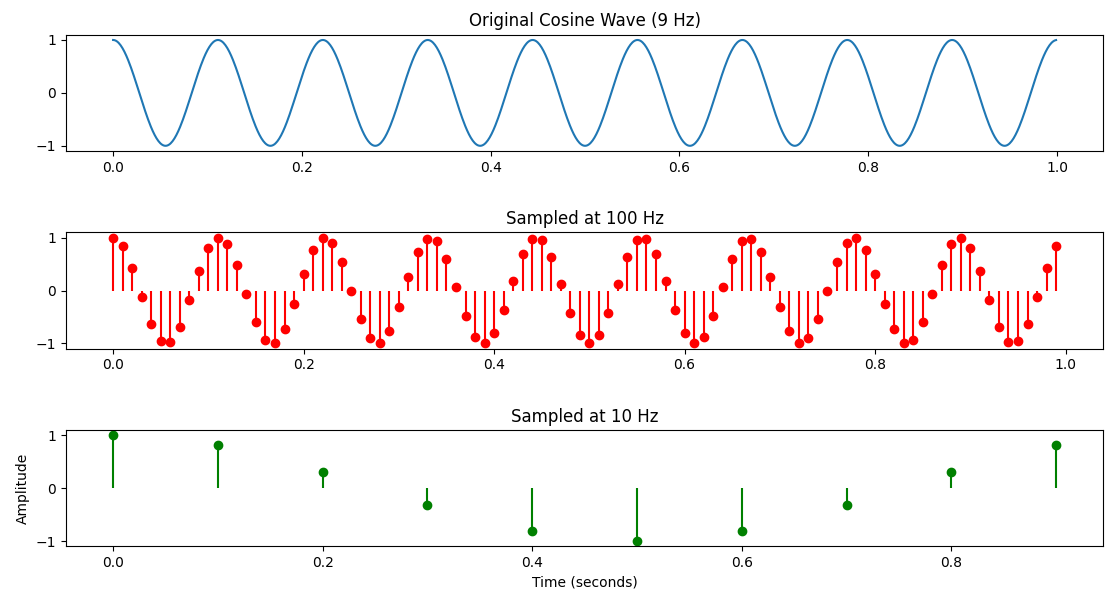
You can see that both the code and the execution results are very similar to the Octave part.
Exercise 4
Practice installing the two mentioned packages and actually run the above code to observe if the results are the same. (It's recommended to create a Python environment using Anaconda or venv, and install the packages with pip install numpy matplotlib)